Introduction
VMware is putting lot of efforts to make tracking of vSAN Capacity utilization simpler. VMware vSAN provides few of the dashboard within vCenter to track capacity utilization, free space remaining, deduplication can compression efficiency and many more. In the latest release, there are more then 200 alarms that provides various alerts for vSAN.
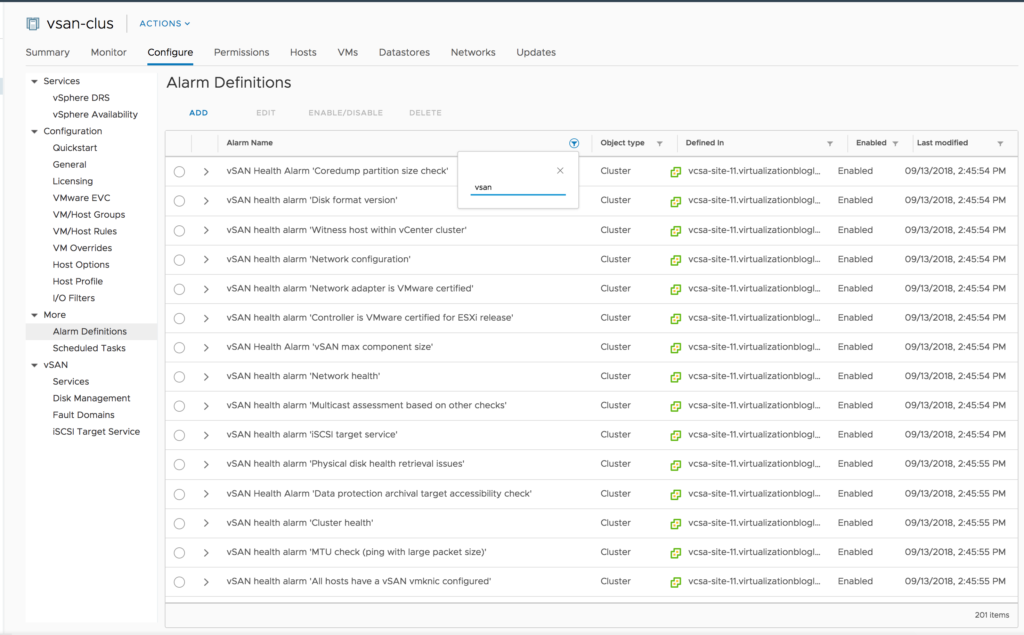
In addition to the capacity dashboard vSAN Health includes capacity-related health checks as well.
vSAN Capacity Overview
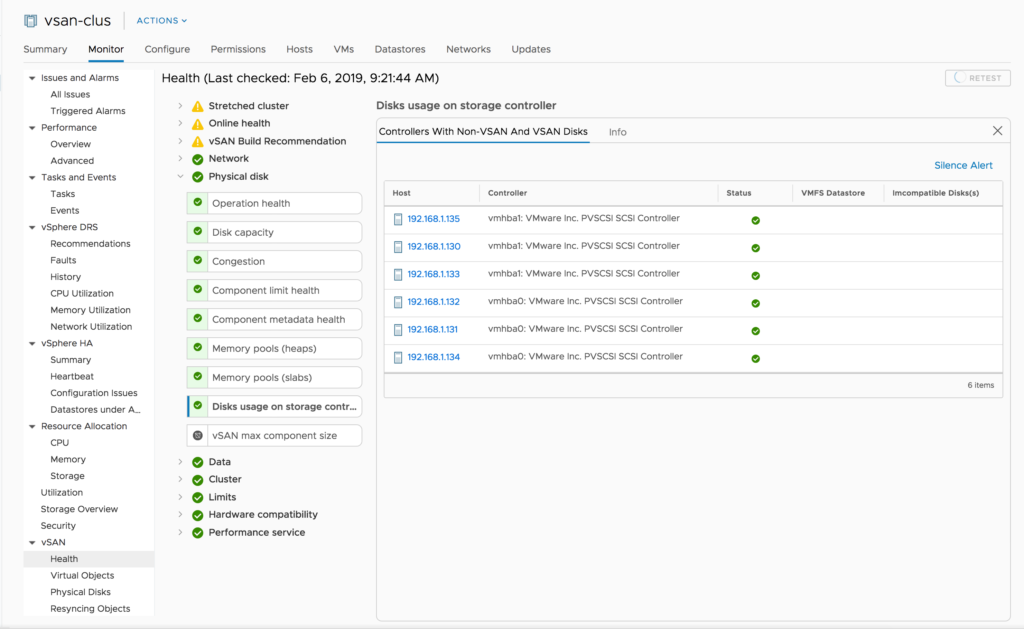
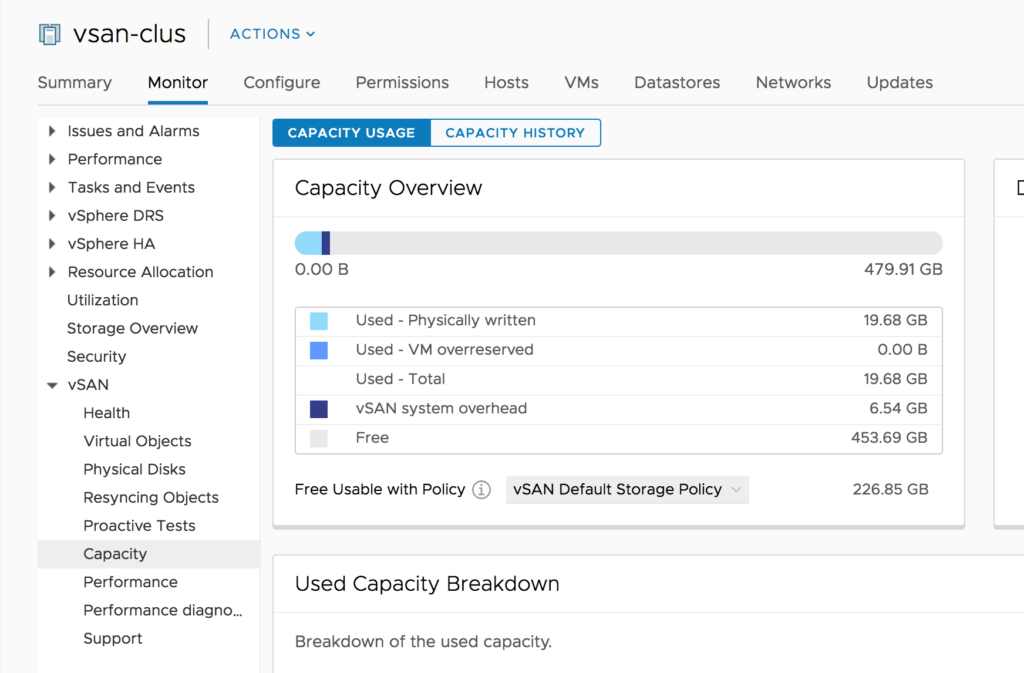
This dashboard part of the vCenter UI provides a capacity overview. The dashboard includes the details on
- Total Raw Capacity of the vSAN Datastore
- Details on Consumed Capacity
- Details on Remaining Capacity
The level of resilience configured has a direct impact on how much useable capacity is used. The vSAN Capacity Overview section enables us to select a storage policy and see how much usable free space remains. In my lab, there is 113.42 GB of “Free Usable with Policy” capacity if I have RAID 5/6 policy as the default policy for vSAN Datastore but there will be close to 226 GB “Free Usable With Policy” when vSAN Default Storage Policy is applied to the vSAN Datastore. All the Capacity Overview metrics are self-explanatory, you can get the metrics details by hovering the mouse cursor over the metric.
VMware recommends keeping 25-30% raw free space on the vSAN datastore for a few reasons such as snapshots. Secondly, vSAN Health will raise an alert if free space drops below 20% on any of the physical vSAN capacity drives. When this happens, vSAN initiates a rebalance operation to evenly distribute vSAN components across capacity drives and free up space on the highly utilized capacity drives.
Used Capacity Breakdown
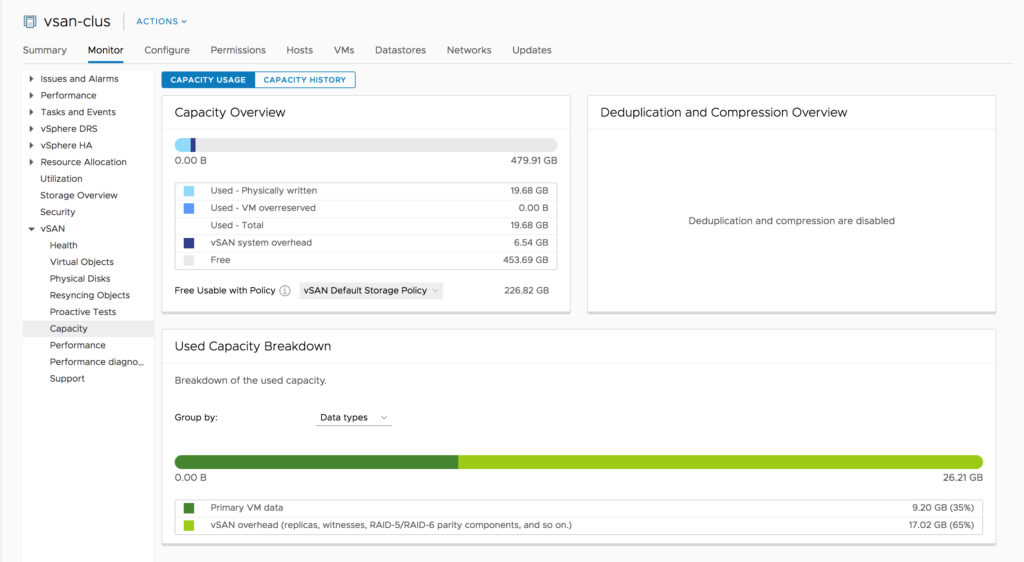
The Used Capacity Breakdown displays the percentage of capacity used by different types or data types. If you select Data types, vSAN displays the percentage of capacity used by primary VM data, vSAN overhead and temporary overhead.
If you want to get details of the capacity used by the individual objects, then you can change the “Group By” to “Objects Type”. If you select Object types vSAN displays the percentage of capacity used by the following object types:
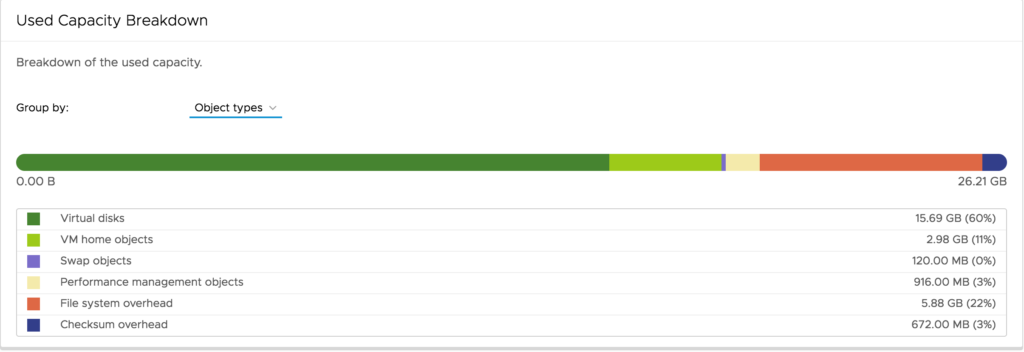
- Virtual disks
- VM home objects
- Swap objects
- Performance management objects
- Vmem objects
- File system overhead
- Checksum overhead
- Deduplication and compression overhead
- Space under deduplication engine consideration
- iSCSI home and target objects, and iSCSI LUNs
- Other, such as user-created files, VM templates, and so on
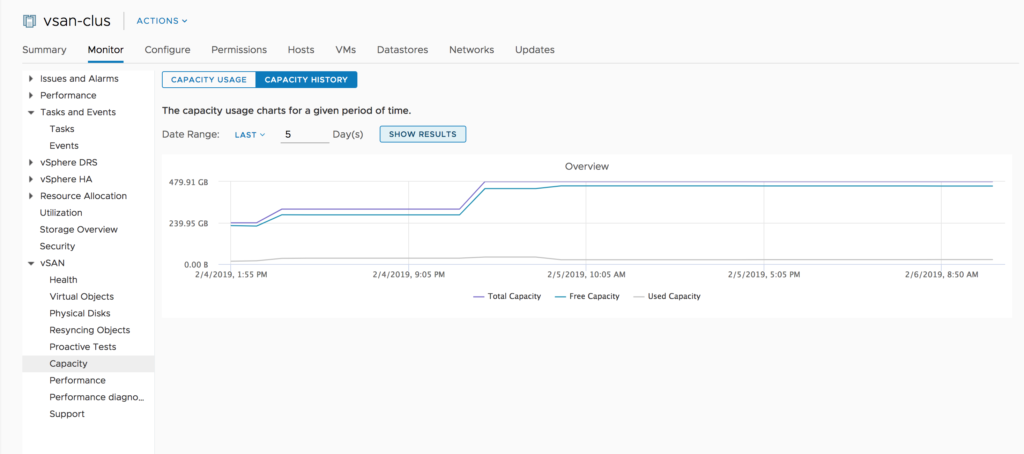
You can also get details on vSAN DataStore Capacity history form “Capacity History” tab. By default it show the Capacity History of 1 day but you can choose the any number of days from 1 – 30.
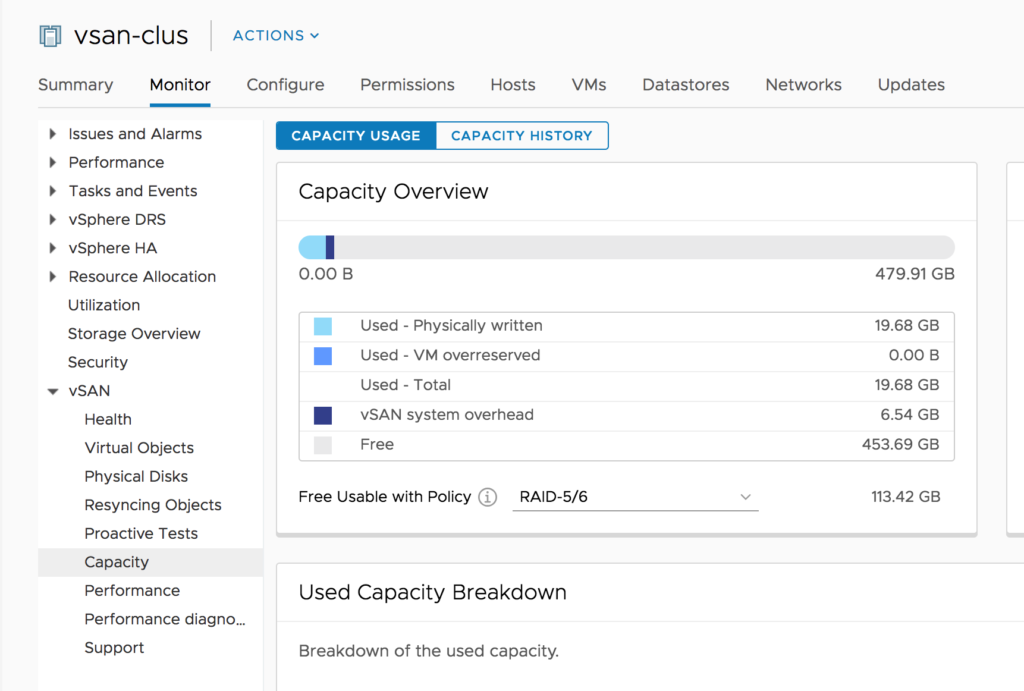
vSAN Health
vSAN Health service keep monitoring the capacity of the vSAN Capacity drives not the vSAN Cache Drives. Till the time the capacity drive utilization is less then 80% the vSAN Health UI will show it as green. It will be changed to Yellow if utilization is between 80% – 95% & Red once the capacity utilization reaches above 95%.
vSAN will trigger automatically rebalance mechanism once the capacity drive utilization crosses 80%. Rebalancing mechanism will attempt to to migrate the data on to the capacity drives with less then 80% utilization in the vSAN Cluster. As migrating the data other capacity drives will generated lot traffic, the rebalancing operations traffic might impact the virtual machine traffic. vSAN’s Adaptive Resync feature monitors and dynamically adjusts resource utilizations to avoid resync traffic contention with virtual machine traffic.
Dashboards in the vSphere Client
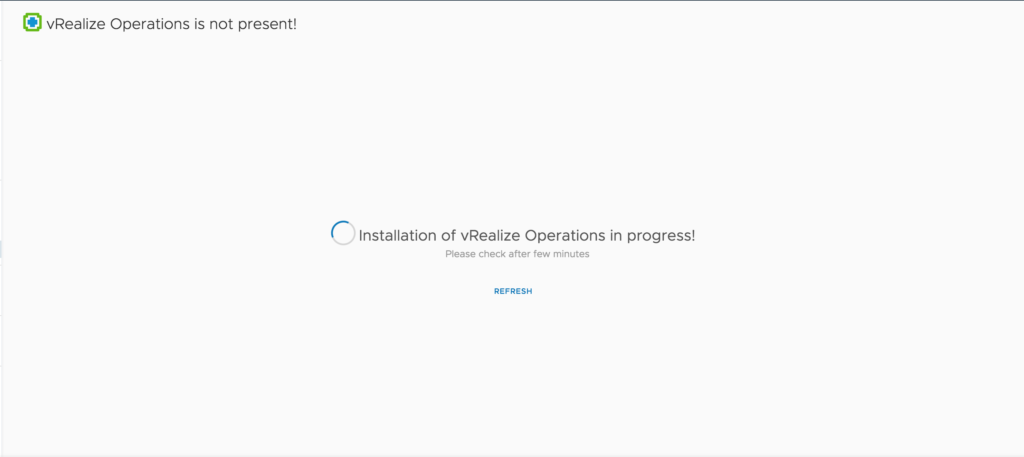
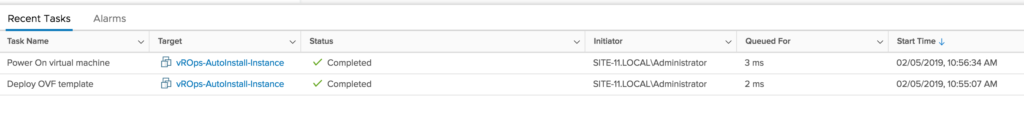
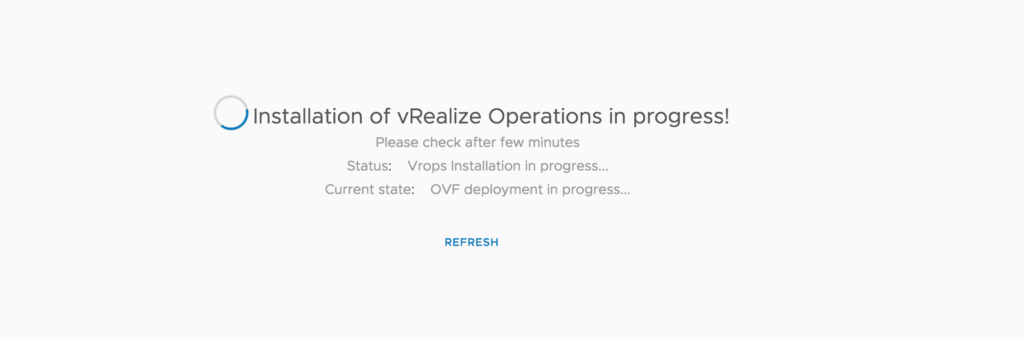
With the latest versions of vSphere VMware have tried to make vSAN monitoring more simple. Now it is very each to deploy vRealize Operations and view dashboards directly in the vSphere Client. The Administrators no need to switch tools and learn a new UI for basic monitoring.
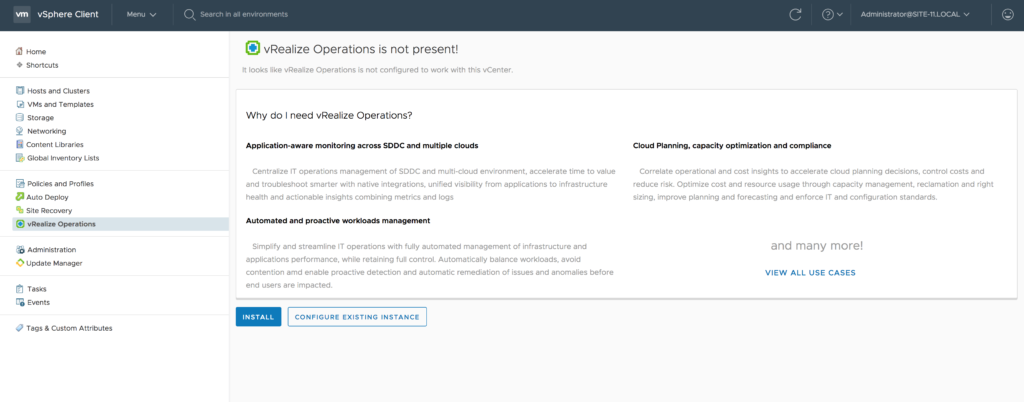
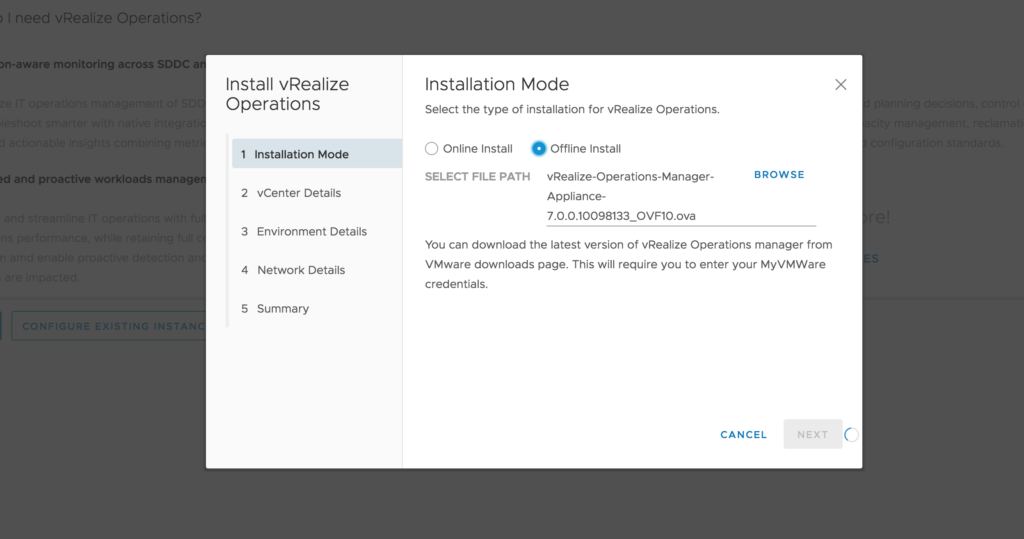
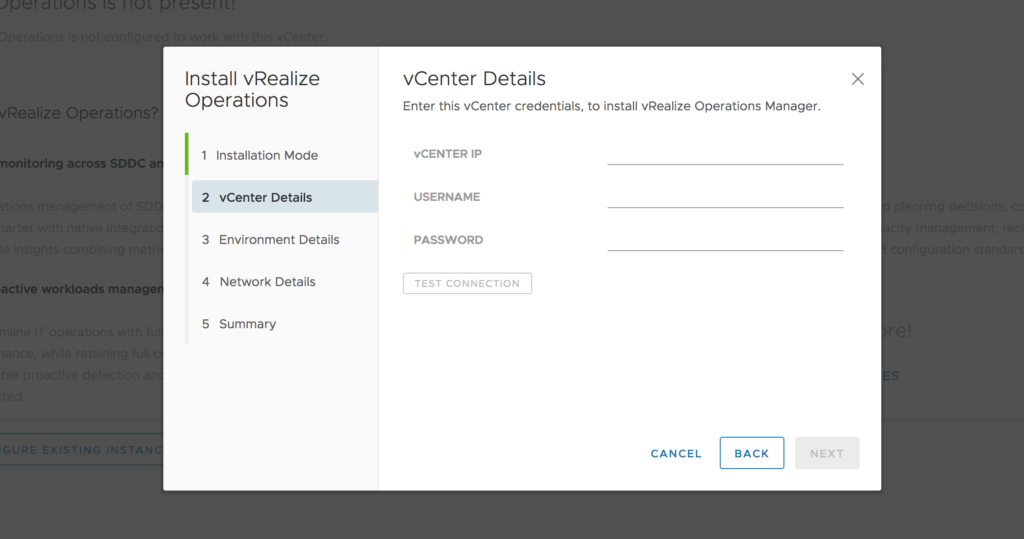
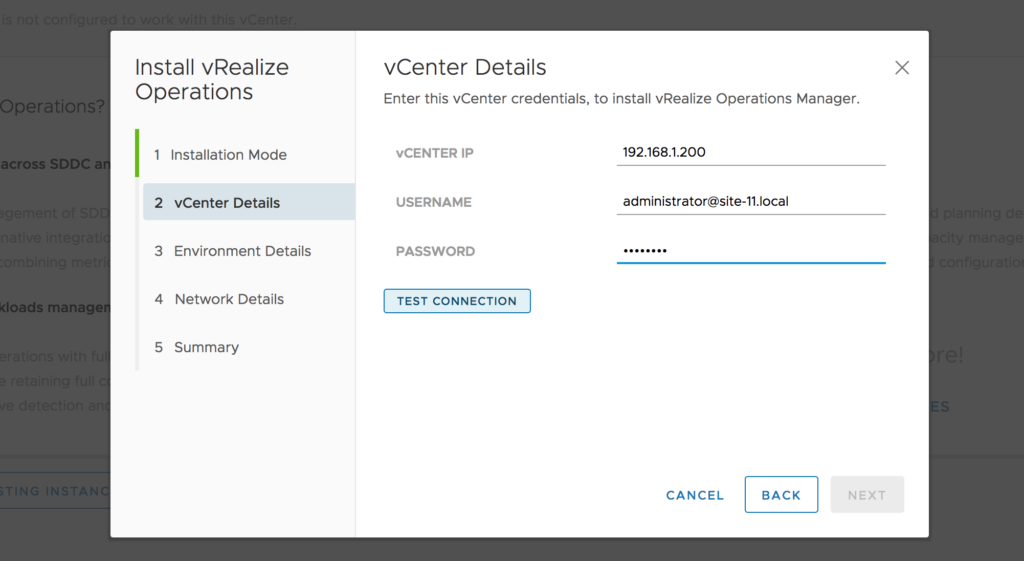
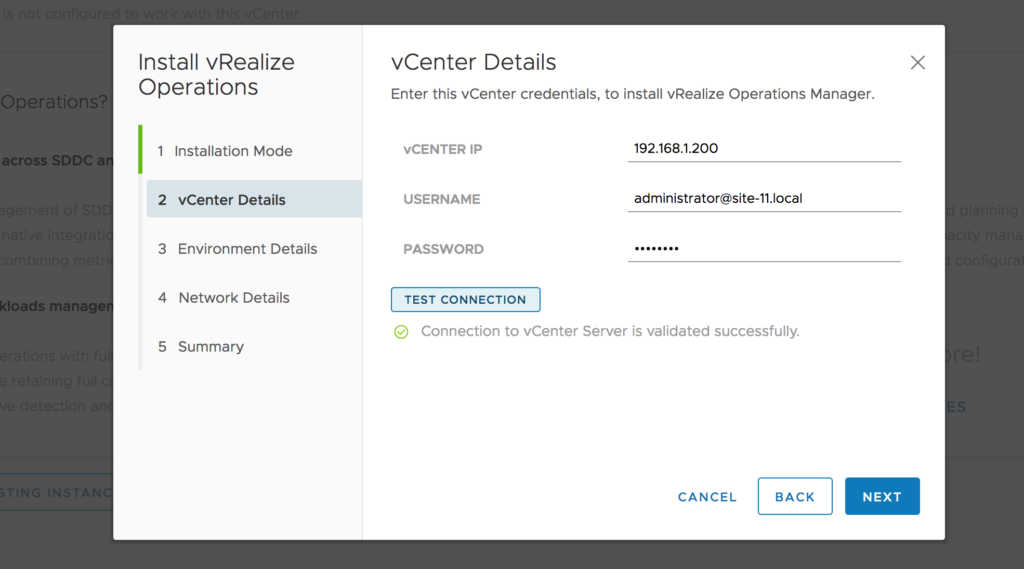
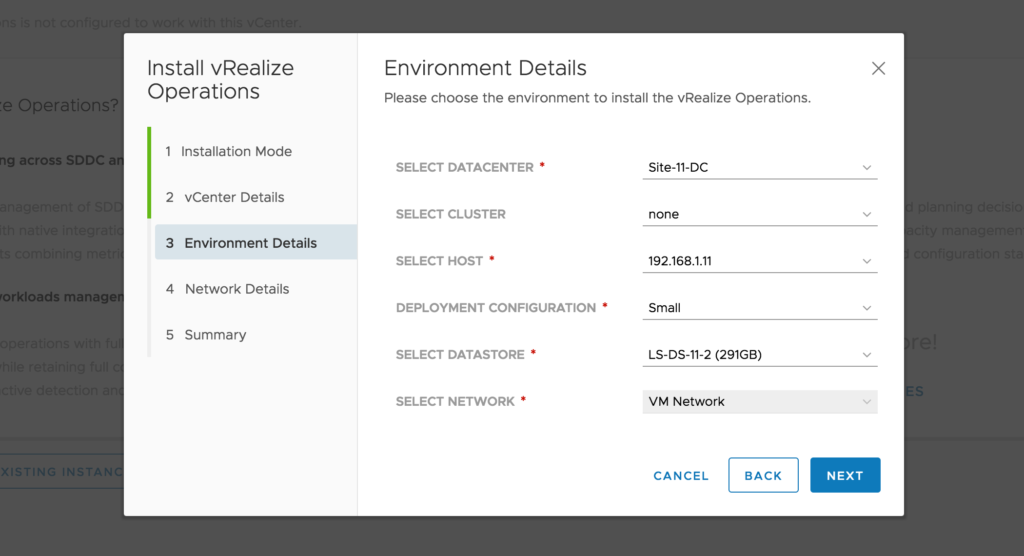
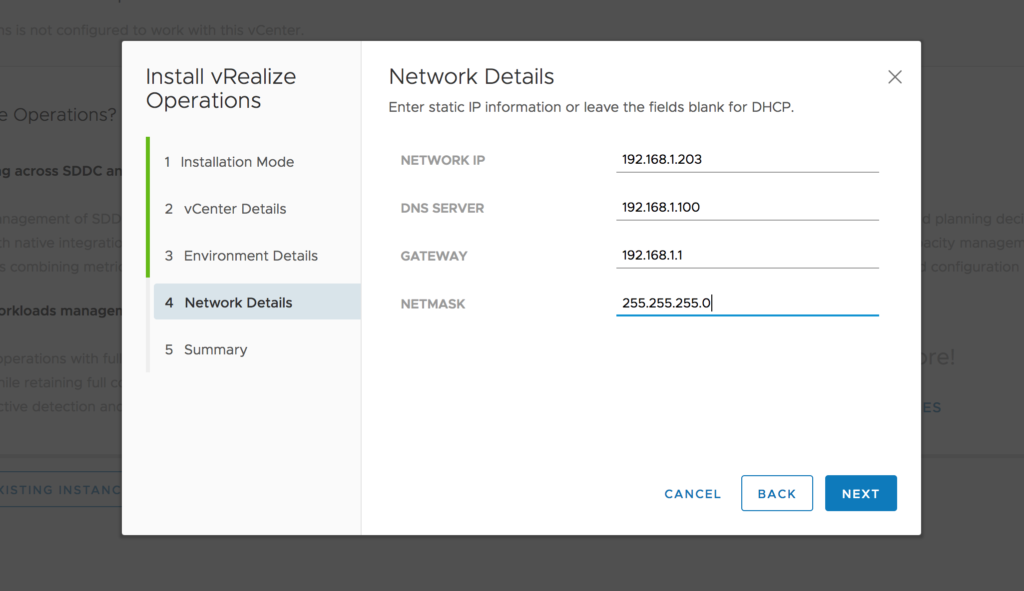
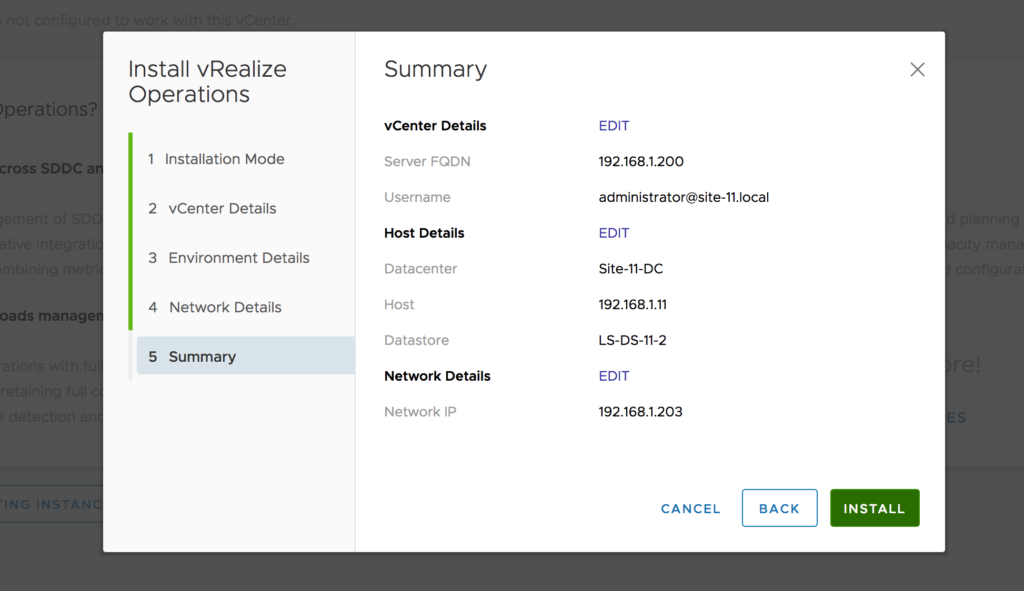
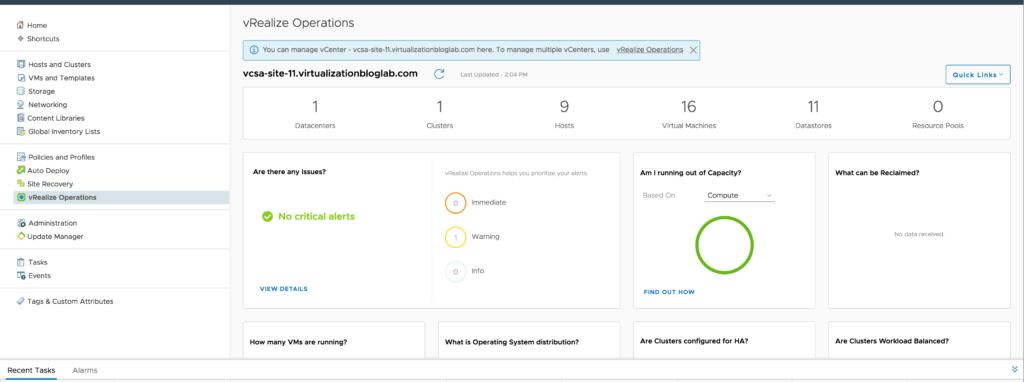
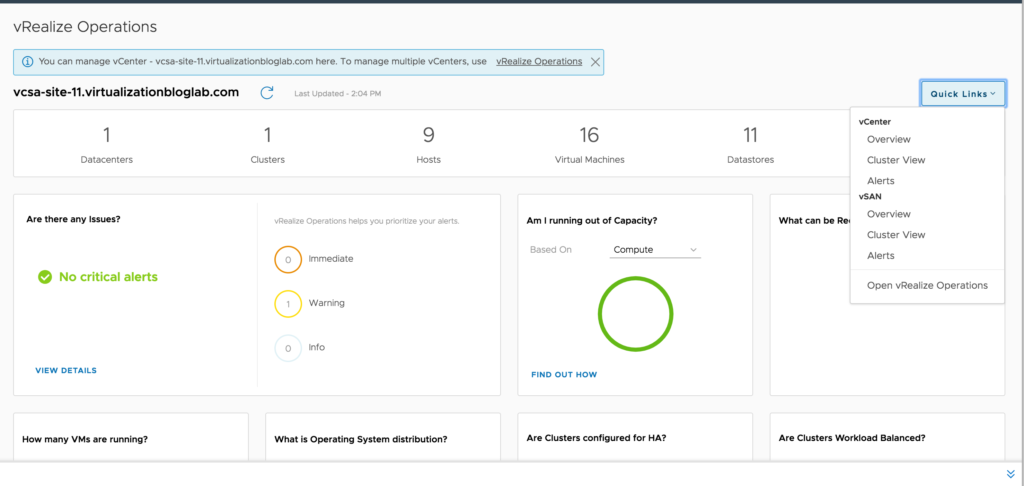
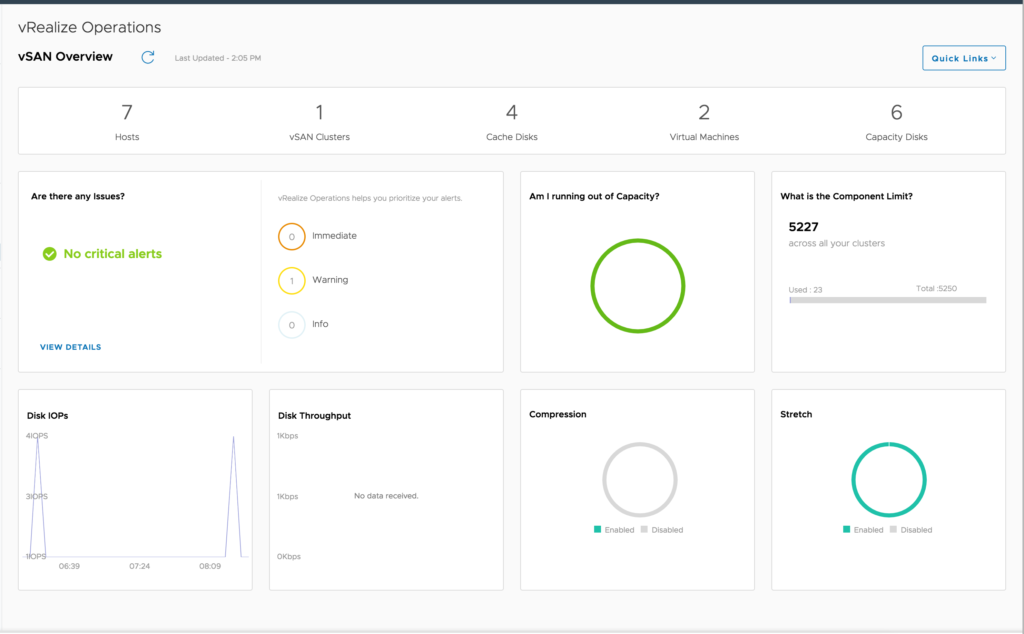 .The vSphere Client shows information such as current utilization and historical trends. vRealize Operations can be deployed, which provides overview dashboards integrated into the vSphere Client for simplicity and ease of use. Hope this will be informative for you. Thanks for reading. Please share if you find worth sharing it!!!